Installation
Binary Download
The CONFSEC CLI binary can be downloaded directly from the CONFSEC Web Console. Click the “Clients” drop down on the top right of the Console and select the desired Operating System and binary architecture.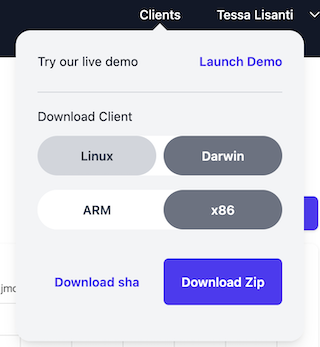
unzip utility, e.g.:
Configuring CONFSEC API Keys
API Keys can be obtained from the “API Keys” tab in the CONFSEC Web Console. Set theAPI_KEY env var to enable the CONFSEC CLI to authenticate to CONFSEC:
Running one-shot prompts
Theconfsec prompt sub-command can be used to run single prompts against the CONFSEC system as follows:
Running interactive chat sessions
Theconfsec prompt sub-command can also be used to start interactive chat sessions as follows:
Running the CONFSEC Proxy
The CONFSEC CLI also supports running in a so-called “proxy” mode, in which the running process serves as a proxy for external callers into the CONFSEC system.21434.
A different port can be assigned via the optional --port flag.
Once this command is running, requests can be forwarded to the CONFSEC system as follows:
Running the Proxy UI
The Proxy UI is a TUI that provides real-time monitoring and debugging capabilities for your requests to CONFSEC system. It displays banking information, attestation status, request logs, and streaming response data in a unified dashboard.Starting the Proxy UI
Interface Overview
The interface is divided into 6 panels arranged in 3 sections:Sections
- Banking Info: Wallet status and credit information
- Attestations: Verified compute nodes and their attestation status
- Transparency Log: Cryptographic transparency statements
- Request Logs: Table showing all HTTP requests with timing and token metrics
- Request Bodies: Raw request content with JSON formatting
- Response Bodies: Streaming response content (including partial responses)
Understanding the Data
Banking Information
- Wallet Status: Current credit balance and account state
- Updates automatically as credits are consumed
Attestation Panel
Shows verified compute nodes that can process your requests:- Node ID: Unique identifier for each compute node
- Tags: Node capabilities (e.g., GPU type, model support)
- Attestation Status: TPM-verified security guarantees
Request Logs Table
Comprehensive metrics for each HTTP request:- Time: Request timestamp
- Method/Path: HTTP details
- Model: AI model being queried (extracted from request body)
- Req/Resp Size: Data transfer amounts
- TTFB/TTLB: Time to first/last byte (performance metrics)
- Tokens: Input/output token counts and processing speed
- Status: HTTP response code
Request/Response Bodies
- Raw Content: Actual request and response data
- Streaming: Response bodies update in real-time as data arrives
- Formatting: JSON requests are escaped and formatted for readability
Log Files
The proxy UI writes detailed logs toproxyui.log in the current directory for debugging purposes.