> ## Documentation Index
> Fetch the complete documentation index at: https://docs.confident.security/llms.txt
> Use this file to discover all available pages before exploring further.
# Confsec CLI
The CONFSEC CLI provides a means of running prompts against the CONFSEC system using a terminal running locally.
## Installation
### Binary Download
The CONFSEC CLI binary can be downloaded directly from the [CONFSEC Web Console](https://app.confident.security/dashboard).
Click the "Clients" drop down on the top right of the Console and select the desired Operating System and binary architecture.
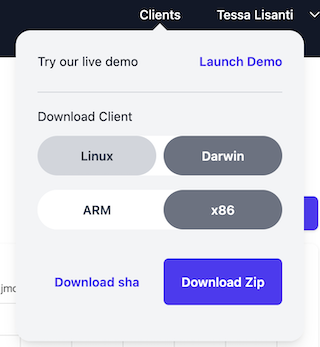 From this pane, the CONFSEC CLI binary's sha256 sum can optionally be downloaded.
This can be used to verify the CONFSEC CLI binary installation as follows, if desired:
```bash theme={null}
$ sha256sum confsec_darwin_arm64.zip
8c74d1fbf663f065cb67f4d1ec26a5d56d05f9012038f73e5a1ad7a1c63d8d18 confsec_darwin_arm64.zip
```
Once verified, the downloaded ZIP artifact can be unpacked using the `unzip` utility, e.g.:
```bash theme={null}
unzip confsec_darwin_arm64.zip
```
## Configuring CONFSEC API Keys
API Keys can be obtained from the "API Keys" tab in the CONFSEC Web Console.
Set the `API_KEY` env var to enable the CONFSEC CLI to authenticate to CONFSEC:
```bash theme={null}
export API_KEY=CONFSEC_1_
```
## Running one-shot prompts
The `confsec prompt` sub-command can be used to run single prompts against the CONFSEC system as follows:
```bash theme={null}
./confsec prompt "this is a test prompt!"
```
## Running interactive chat sessions
The `confsec prompt` sub-command can also be used to start interactive chat sessions as follows:
```bash theme={null}
./confsec prompt --interactive
```
The interactive chat mode provides the following commands to be invoked during the session:
```
Available Commands:
:q, :quit, /q, exit, quit - Exit the prompt
:h, :help, /h, ?, help - Show this help
:w, :wallet, /w - Show the contents of your wallet
:c NUMBER - Set a custom credit amount
:n COMMA SEPARATED TAGS - Set the tags of the compute nodes that can run workloads
:m MODEL_NAME - Set the default model to query
:models - Show available models
[text] - Query inference engine
```
## Running the CONFSEC Proxy
The CONFSEC CLI also supports running in a so-called "proxy" mode, in which the running
process serves as a proxy for external callers into the CONFSEC system.
```bash theme={null}
./confsec proxy
```
This sub-command is blocking, and by default creates a listener on port `21434`.
A different port can be assigned via the optional `--port` flag.
Once this command is running, requests can be forwarded to the CONFSEC system as follows:
```bash theme={null}
curl -X POST http://localhost:21434/v1/completions \
-H 'Content-Type: application/json' \
-d '{"model":"gemma3:1b","prompt":"why is the sky blue?","stream":true}'
```
The running proxy process will display some logs pertaining to the proxied requests.
## Running the Proxy UI
The Proxy UI is a TUI that provides real-time monitoring and debugging capabilities for your requests to CONFSEC system. It displays banking information, attestation status, request logs, and streaming response data in a unified dashboard.
### Starting the Proxy UI
```bash theme={null}
# Set your API key
export API_KEY="CONFSEC_1_..."
# Start the proxy UI (default port 21434)
confsec proxyui 2> proxyui.log
# Or specify custom port
confsec proxyui --port 8080 2> proxyui.log
```
### Interface Overview
The interface is divided into 6 panels arranged in 3 sections:
#### Sections
* **Banking Info**: Wallet status and credit information
* **Attestations**: Verified compute nodes and their attestation status
* **Transparency Log**: Cryptographic transparency statements
* **Request Logs**: Table showing all HTTP requests with timing and token metrics
* **Request Bodies**: Raw request content with JSON formatting
* **Response Bodies**: Streaming response content (including partial responses)
### Understanding the Data
#### Banking Information
* **Wallet Status**: Current credit balance and account state
* Updates automatically as credits are consumed
#### Attestation Panel
Shows verified compute nodes that can process your requests:
* **Node ID**: Unique identifier for each compute node
* **Tags**: Node capabilities (e.g., GPU type, model support)
* **Attestation Status**: TPM-verified security guarantees
#### Request Logs Table
Comprehensive metrics for each HTTP request:
* **Time**: Request timestamp
* **Method/Path**: HTTP details
* **Model**: AI model being queried (extracted from request body)
* **Req/Resp Size**: Data transfer amounts
* **TTFB/TTLB**: Time to first/last byte (performance metrics)
* **Tokens**: Input/output token counts and processing speed
* **Status**: HTTP response code
#### Request/Response Bodies
* **Raw Content**: Actual request and response data
* **Streaming**: Response bodies update in real-time as data arrives
* **Formatting**: JSON requests are escaped and formatted for readability
### Log Files
The proxy UI writes detailed logs to `proxyui.log` in the current directory for debugging purposes.
From this pane, the CONFSEC CLI binary's sha256 sum can optionally be downloaded.
This can be used to verify the CONFSEC CLI binary installation as follows, if desired:
```bash theme={null}
$ sha256sum confsec_darwin_arm64.zip
8c74d1fbf663f065cb67f4d1ec26a5d56d05f9012038f73e5a1ad7a1c63d8d18 confsec_darwin_arm64.zip
```
Once verified, the downloaded ZIP artifact can be unpacked using the `unzip` utility, e.g.:
```bash theme={null}
unzip confsec_darwin_arm64.zip
```
## Configuring CONFSEC API Keys
API Keys can be obtained from the "API Keys" tab in the CONFSEC Web Console.
Set the `API_KEY` env var to enable the CONFSEC CLI to authenticate to CONFSEC:
```bash theme={null}
export API_KEY=CONFSEC_1_
```
## Running one-shot prompts
The `confsec prompt` sub-command can be used to run single prompts against the CONFSEC system as follows:
```bash theme={null}
./confsec prompt "this is a test prompt!"
```
## Running interactive chat sessions
The `confsec prompt` sub-command can also be used to start interactive chat sessions as follows:
```bash theme={null}
./confsec prompt --interactive
```
The interactive chat mode provides the following commands to be invoked during the session:
```
Available Commands:
:q, :quit, /q, exit, quit - Exit the prompt
:h, :help, /h, ?, help - Show this help
:w, :wallet, /w - Show the contents of your wallet
:c NUMBER - Set a custom credit amount
:n COMMA SEPARATED TAGS - Set the tags of the compute nodes that can run workloads
:m MODEL_NAME - Set the default model to query
:models - Show available models
[text] - Query inference engine
```
## Running the CONFSEC Proxy
The CONFSEC CLI also supports running in a so-called "proxy" mode, in which the running
process serves as a proxy for external callers into the CONFSEC system.
```bash theme={null}
./confsec proxy
```
This sub-command is blocking, and by default creates a listener on port `21434`.
A different port can be assigned via the optional `--port` flag.
Once this command is running, requests can be forwarded to the CONFSEC system as follows:
```bash theme={null}
curl -X POST http://localhost:21434/v1/completions \
-H 'Content-Type: application/json' \
-d '{"model":"gemma3:1b","prompt":"why is the sky blue?","stream":true}'
```
The running proxy process will display some logs pertaining to the proxied requests.
## Running the Proxy UI
The Proxy UI is a TUI that provides real-time monitoring and debugging capabilities for your requests to CONFSEC system. It displays banking information, attestation status, request logs, and streaming response data in a unified dashboard.
### Starting the Proxy UI
```bash theme={null}
# Set your API key
export API_KEY="CONFSEC_1_..."
# Start the proxy UI (default port 21434)
confsec proxyui 2> proxyui.log
# Or specify custom port
confsec proxyui --port 8080 2> proxyui.log
```
### Interface Overview
The interface is divided into 6 panels arranged in 3 sections:
#### Sections
* **Banking Info**: Wallet status and credit information
* **Attestations**: Verified compute nodes and their attestation status
* **Transparency Log**: Cryptographic transparency statements
* **Request Logs**: Table showing all HTTP requests with timing and token metrics
* **Request Bodies**: Raw request content with JSON formatting
* **Response Bodies**: Streaming response content (including partial responses)
### Understanding the Data
#### Banking Information
* **Wallet Status**: Current credit balance and account state
* Updates automatically as credits are consumed
#### Attestation Panel
Shows verified compute nodes that can process your requests:
* **Node ID**: Unique identifier for each compute node
* **Tags**: Node capabilities (e.g., GPU type, model support)
* **Attestation Status**: TPM-verified security guarantees
#### Request Logs Table
Comprehensive metrics for each HTTP request:
* **Time**: Request timestamp
* **Method/Path**: HTTP details
* **Model**: AI model being queried (extracted from request body)
* **Req/Resp Size**: Data transfer amounts
* **TTFB/TTLB**: Time to first/last byte (performance metrics)
* **Tokens**: Input/output token counts and processing speed
* **Status**: HTTP response code
#### Request/Response Bodies
* **Raw Content**: Actual request and response data
* **Streaming**: Response bodies update in real-time as data arrives
* **Formatting**: JSON requests are escaped and formatted for readability
### Log Files
The proxy UI writes detailed logs to `proxyui.log` in the current directory for debugging purposes.